Polls are something we encounter everyday in the media. We are constantly bombarded with numbers of how many people approve of the President’s performance or how many people prefer one brand of soda over another. Politicians and corporations want to know what we are thinking and doing. But they can’t ask all of us all the time. Instead they pick a few people, a sample, that can be easily surveyed. Just as one can taste a small sample of ice cream flavors at an ice cream counter, so can we sample a few people to find out what the public at large is thinking.
Countries: US
-
Producing Data: Experimentation
Every day, the media bombard us with the results of recent statistical studies. Statements like, “Studies show our products are better than ever…” appear frequently in news releases and advertisements. Many of these studies claim results based on experiments. But what constitutes a proper experiment? How do we know the results are reliable and have real meaning? How does one design an experiment to ensure that the research objective is properly addressed? Resolving these issues are part of the statistician’s role in research.
-
Regression
We have all had the experience watching our friends and family play sports or games. Based on prior performance, we predict in our heads how they will do in the next game, and we are often right. By keeping track of variables like bowling scores or chips in a poker game, one can predict how well someone will do in the next event.
-
Two- Way Tables
Researchers are often interested in variables that are categorical in nature. These often involve people who fall into certain groups, such as age, gender, political affiliation, or religion. These groups can also be defined as yes or no categories, especially in medicine. Patients get well or remain ill, survive cancer or don’t, improve on mobility tests or decline.
-
Displaying Data
This lesson begins by explaining statistics and how it is used by scientists. You will learn that statistics is not a meaningless compilation of data, rather it is a tool that helps us evaluate real events that have great impact on our everyday lives. You will learn about the types of data that researchers collect, how the data is displayed, and finally, how data is initially interpreted.
-
Describing Distributions
Professionals of all types must make sense out of the huge amounts of data they collect on a daily basis. Researchers first try to impose some sort of order on their data by looking at the average values and the extent to which their numbers vary from day to day or month to month. Business owners face the challenge of making sure they have enough staff to accommodate customers while not having so many that it hurts their bottom line. Using the right descriptions of their data enables management to schedule workforces appropriately.
-
Normal Distributions
As you have seen in earlier lessons, statisticians have visual and numerical ways of describing a set of data. Histograms are one of the most common ways to display numerical data. By looking at a histogram, we can easily see the mean and spread of the data. In this lesson, you will learn how the visual impression of a histogram is translated into curves that closely describe the data.
-
Scatterplots & Correlation
Questions about the relationship between two variables are asked all the time. Will time spent in a certain rehab program really increase an addict’s chance of not relapsing? Will extra minutes spent training athletes result in better performance or increase fatigue and decrease performance? Is the increased carbon dioxide in the atmosphere really increasing the earth’s temperature? All these questions can be addressed by statistics and analyzed initially through a display called a scatterplot.
-
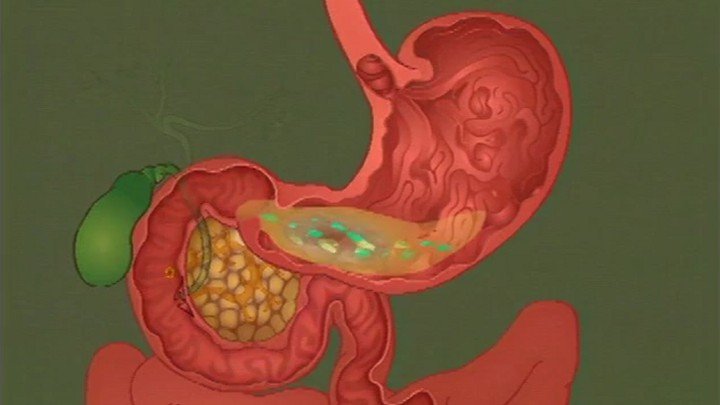
The Digestive System, Nutrition & Metabolism
Every cell in the body needs nutrients to survive and do work. The nutrients come from food, which is physically and chemically broken down in the digestive system. After the food is digested, the nutrients pass into the bloodstream and supply the body’s cells with the nutrients they need.
-
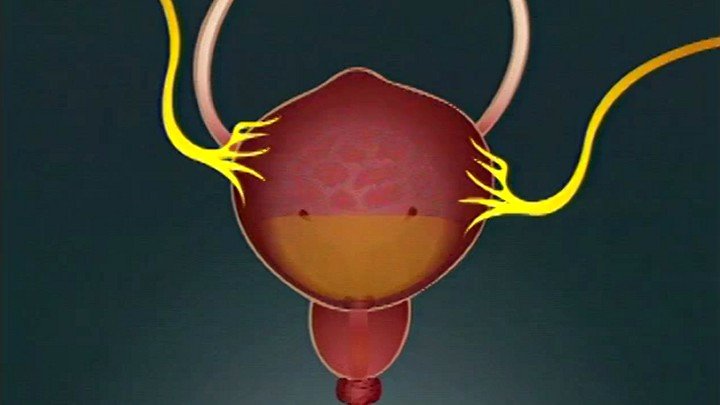
The Urinary System
Our bodies take nutrients from food and use them to maintain all bodily functions. After the body uses what it needs from the food and drink, waste products from digestion and cellular metabolism need to be eliminated. The urinary system works with the respiratory system, integumentary system, and digestive system to excrete wastes and keep electrolytes and water in the body balanced.